Climate and Weather Charts
Nice Cote d'Azur Airport (NCE)
(Nice, France)

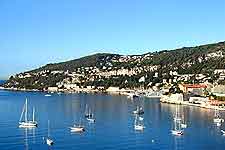
Nice features a mild, temperate climate and is situated in the Cote d'Azur area of south-eastern France, close to the Italy border. The city of Nice occupies and enviable location along the coastline and next to the Mediterranean Sea, which noticeably moderates the climate and temperatures.
With warm summer temperatures averaging 26°C / 79°F between June and August, Nice is particularly popular at this time of the year, when the average rainfall is at its lowest. Even during the winter months, showers are quick to clear on most days and the winter climate remains mild, averaging 13°C / 55°F, occasionally climbing to 17°C / 63°F or 18°C / 64°F during the sunniest weather. The average annual daytime temperatures in Nice are around 19°C / 66°F.
Climate Description: Mild, temperate climate
Nice Cote d'Azur Airport (NCE) Location: Northern Hemisphere, France
Annual High / Low Daytime Temperatures at Nice: 27°C / 13°C (81°F / 55°F)
Average Daily January Temperature: 13°C / 55°F
Average Daily June Temperature: 23°C / 73°F
Annual Rainfall / Precipication Nice at Airport (NCE): 806 mm / 32 inches
Nice Cote d'Azur Airport (NCE):
Climate and Weather Charts
Temperature Chart |
| Temperatures |
Jan |
Feb |
Mar |
Apr |
May |
Jun |
Jul |
Aug |
Sep |
Oct |
Nov |
Dec |
Average |
Maximum
Celcius (°C) |
13 |
13 |
14 |
16 |
19 |
23 |
26 |
27 |
24 |
20 |
16 |
13 |
19 |
Minimum
Celcius (°C) |
6 |
6 |
8 |
9 |
13 |
17 |
19 |
20 |
17 |
13 |
9 |
6 |
12 |
Maximum
Fahrenheit (°F) |
55 |
55 |
57 |
61 |
66 |
73 |
79 |
81 |
75 |
68 |
61 |
55 |
66 |
Minimum
Fahrenheit (°F) |
43 |
43 |
46 |
48 |
55 |
63 |
66 |
68 |
63 |
55 |
48 |
43 |
53 |
Rainfall / Precipitation Chart |
| Rainfall |
Jan |
Feb |
Mar |
Apr |
May |
Jun |
Jul |
Aug |
Sep |
Oct |
Nov |
Dec |
Total |
| Rainfall (mm) |
76 |
74 |
74 |
64 |
48 |
38 |
18 |
30 |
66 |
112 |
117 |
89 |
806 |
| Rainfall (inches) |
3.0 |
2.9 |
2.9 |
2.5 |
1.9 |
1.5 |
0.7 |
1.2 |
2.6 |
4.4 |
4.6 |
3.5 |
32 |
| Nice Days of Rain |
6 |
3 |
4 |
6 |
5 |
3 |
2 |
3 |
5 |
5 |
7 |
4 |
53 |
Seasonal Chart |
| Seasons |
Average
Temp
(Max °C) |
Average
Temp
(Min °C) |
Average
Temp
(Max °F) |
Average
Temp
(Min °F) |
Total
Rainfall
(mm) |
Total
Rainfall
(inches) |
| Mar to May (Spring) |
16 |
10 |
61 |
50 |
186 |
7 |
| Jun to Aug (Summer) |
25 |
19 |
78 |
66 |
86 |
3 |
| Sept to Nov (Autumn / Fall) |
20 |
13 |
68 |
55 |
295 |
12 |
| Dec to Feb (Winter) |
13 |
6 |
55 |
43 |
239 |
9 |
 Nice features a mild, temperate climate and is situated in the Cote d'Azur area of south-eastern France, close to the Italy border. The city of Nice occupies and enviable location along the coastline and next to the Mediterranean Sea, which noticeably moderates the climate and temperatures.